The Numbers

$163M
Total Loan Volume
17 loans fully realized
26
Total Loans
Zero fund leverage across all three generations
19.4%
Consolidated Loan-Level IRR
100% first lien loan commitments in Fund I
45.4%
Blended LTV
The track record of a firm built on one rule: do not lose the money.
Fund by Fund
First Pool of Capital
2019 to 2022
Loan Volume
$8M
Loans
3 (all realized)
LTV
53.1%
IRR
12.8%
The founding thesis tested on three Las Vegas deals. First personal loans deployed 2016. All three fully realized. The strategy proved itself at the smallest scale.
Debt Fund 1
2021 to 2025
Loan Volume
$31M
Loans
7 (all realized)
LTV
40.8%
IRR
18.3%
Scale increased. IRR improved. LTV tightened. The discipline of the strategy produced better results as the team refined its approach.
Debt Fund 11
2024 to est. 2029
Loan Volume
$124M
Loans
16 (7 realized, 9 active)
LTV
46.3%
IRR
23.6%
Geographic expansion into Boise, Phoenix, Salt Lake City, and Houston. Deal sizes grew. IRR improved again. The growth markets thesis delivered exactly as modeled.
Deal Highlights

Las Vegas, NV and Salt Lake City, UT
FO Portfolio Cash Out
A cash-out loan on an income-producing office and retail portfolio at 20.8% LTV. Disciplined underwriting at a conservative entry point produced a 31.2% IRR in four months.
Phoenix, AZ
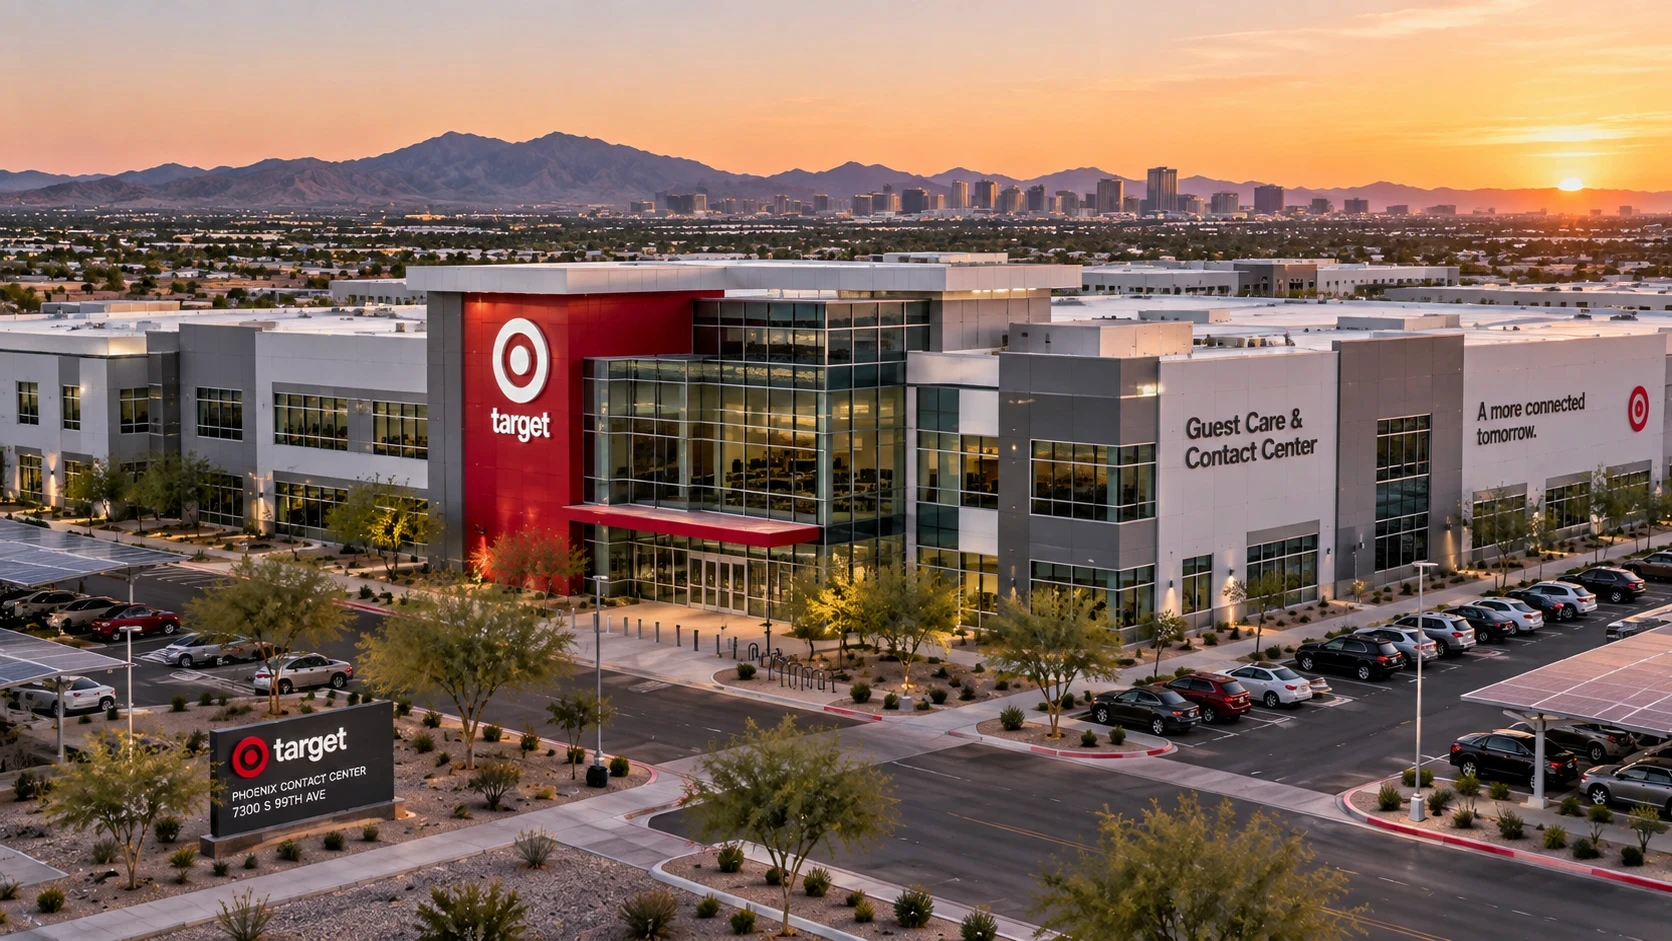
Target Office Acquisition
An acquisition loan on an office asset in Phoenix. Off-market sourcing and execution speed created the return.

Houston, TX
Parkside Heights Build to Rent
A construction loan on a build-to-rent residential project in Houston. The growth markets thesis applied to the build-to-rent sector.

Boise, ID
Kuna Vertical Construction
A vertical construction loan on retail in Boise. Local relationships provided early access to a deal not available on the open market.

Park City, UT
Deer Valley East Marcella
A construction loan on single family residential in Park City. Mountain West luxury residential demand and strong borrower quality.


Clayton Jones
Lead Investment Officer, Multi-Billion Dollar Family Office
I built and ran a regional brokerage firm with 3,500 agents and employees. This is my third sizable fund investment with Francis and his team. What I love besides the quarterly cash flow is the fund reporting and strict loan metrics they adhere to. They are also totally transparent, far better than I have experienced with large institutional funds.

Mark Stark
Founder and Former CEO, Regional Brokerage Firm
I built and ran a regional brokerage firm with 3,500 agents and employees. This is my third sizable fund investment with Francis and his team. What I love besides the quarterly cash flow is the fund reporting and strict loan metrics they adhere to. They are also totally transparent, far better than I have experienced with large institutional funds.

Liam Carter
Founder, Regional Brokerage Firm
Track record reflects consolidated loan-level performance across three fund generations managed by Francis and entities he founded. Past performance is not indicative of future results. IRR reflects loan-level gross IRR prior to co-investments, participations, fund fees, carried interest, and expenses. All return figures are unaudited and subject to change. As of December 2025.